What is the connection between the Mandelbrot set and Julia sets?
Are Julia and Mandelbrot sets the only types of fractals using complex numbers?
What are the maths and the programming peculiarities of fractal music?
![]()
![]()
4. More theoretical fractal information
4A. More maths
|
4Aa. |
What are complex numbers? |
|
|
|
We know that in traditional arithmetic, whether a positive or a negative number is squared, the result is always positive. It is why, in this traditional arithmetic, the square root of a negative number has no meaning. But mathematicians said “why not?”, and they invented imaginary numbers. They named i as the square root of -1 and said that imaginary numbers can be written as a.i, with a being any real number. Moreover they invented complex numbers z with the following structure: z=x+yi where x is the real part of the number and y the imaginary part. |
|
|
4Ab. |
What are the rules to calculate with complex numbers? |
|
|
|
The arithmetic of complex numbers works mostly like regular algebra with a couple of additional formulas:
More details can be found in any complex analysis book. See also:
|
|
|
4Ac. |
How can complex numbers be represented graphically? |
|
|
|
Very simply: in z=x+yi, x and y are real numbers, so they and can be considered as the coordinates of a point: the x axis being the real axis, and the y axis being the imaginary one (the unit used to graduate this axis represent i). The plane defined by this system of coordinates is called the complex plane.
|
|
||||
|
4Ad. |
What are critical points? |
|
|
|
When computing the Mandelbrot set, zero is the critical point of the polynomial z=z2+c; that is, a point where the derivative (here 2z) is equal to 0. If you replace z2+c with a different function, the starting value will have to be modified. E.g. for z2+z, the critical point is 2z+1=0, so start with z=-0.5. In some cases, there may be multiple critical values, so they should all be tested. |
|
|
4Ae. |
What are orbits? |
|
|
|
When a complex polynomial is iterated, the point representing z runs through successive positions which define a trajectory, named the orbit of the point. The properties of the orbit can be used to color the point of the complex plane used to do the iteration (see question 5Ba and following). For example, Fractint offers a very nice option to see the orbit of a point: strike the <o> key, then the <l> key when the Mandelbrot or a Julia set is displayed on the screen and place the cursor on different points of the image. It is easy to see that the orbit never escapes when the cursor is in the set, and that it escapes out of the limits of the window (in fact, towards infinity) when the cursor is on a brightly colored zone outside the set. |
|
||
|
|
A point inside the Mandelbrot set never escapes |
|
|||
|
|
This point outside the set escapes after a few iterations |
|
|||
|
|
|
|
|||
|
4Af. |
What are quaternions? |
|
|
|
Quaternions have 4 components (1 real and 3 imaginaries) a+ib+jc+kd compared to the 2 components of complex numbers. Operations such as additions and multiplications can be performed on quaternions, but multiplication is not commutative.
When quaternions are used to write fractal formulas, the corresponding figures are in a 4D space, and obviously that constitutes a problem to draw such an image. By keeping constant one of the terms, it is possible to get a 3D “slice” of the quaternionic fractal and to draw a projection (2D) on the screen of this 3D figure (see question 4Ch). See:
|
|
|
4Ag. |
What are hypercomplex numbers? |
|
|
|
The following text is made of of selected quotations from the Fractint manual (with permission from Tim Wegner) with a few modifications. Note that this expression is confusing. In several texts it is said that hypercomplex numbers are quaternions and octonions (numbers with 1 real part and 7 imaginary parts). It is not the meaning of hypercomplex here. Hamilton, who invented quaternions in 1843, considered an alternative called the hypercomplex number system. Unlike quaternions, the hypercomplex numbers satisfy the commutative law of multiplication. The law which fails is the field property, that states that all non-zero elements of a field have a multiplicative inverse. For a non-zero hypercomplex number h, the multiplicative inverse 1/h does not always exist.
Note that now ij=kand ji=k (and similarly for other products of pairs of basis vectors), so the commutative law holds.
The numbers a and b are complex numbers. We can represent h as the pair of complex numbers (a,b). Conversely, if we have a hypercomplex number given to us in the form (a,b), we can solve for x, y,z, and w. |
|
|
4Ah. |
What is fractal dimension? |
|
|
|
Everybody knows that the dimension of a point is 0, the dimension of a line is 1, the dimension of a surface is 2, the dimension of a volume is 3. And since Einstein discovered his theory of relativity, we know that we live in a space-time continuum of dimension 4. The fractal dimension D, for a linear figure, is defined as log (L2/L1) where L1, L2 are the lengths measured on the curve (expressed in number of units), and S1, S2 are the sizes of the unit (i.e.. the scale) used for the measurements.
If we use this formula to calculate the dimension of the von Koch curve, it shows that, when a unit segment of length L/3 is used, the length of the curve is multiplied by 4 and the ratio log 4/log 3=1.261859507143 which is the fractal dimension of the von Koch curve. For more information:
|
|
|
4Ai. |
Is it really necessary to know that? |
|
|
|
Are you afraid? Don’t worry. All this knowledge is very useful for those who want to create their own formulas, but there are thousand of formulas that you can freely use (thanks to all their creators). Fractal programs apply all these rules for you very well! If you don’t like math, forget all these formulas; but it is better to understand what complex numbers are... and, perhaps, quaternions and hypercomplex numbers which are employed in some programs. |
|
|
4Aj. |
Where can I find good tutorials or useful sites on the web? |
|
|
|
There are many pages explaining what are fractals, how to make images, applications of fractals, etc. Here is a short list.
On fractals and chaos
And a very famous site were you can find a lot of information, programs...
|
|
4B. Chaos
|
4Ba. |
What is chaos? |
|
|
|
Chaos is apparently an unpredictable behavior arising in a deterministic system because of great sensitivity to initial conditions. Chaos arises in a dynamical system if two arbitrarily close starting points diverge exponentially, so that their future behavior is eventually unpredictable. |
|
|
4Bb. |
Are fractals and chaos synonymous? |
|
|
|
No. Many people do confuse the two domains because, regularly, books or papers about chaos either speak of the two concepts or are illustrated with fractals.
from Third Apex to Fractovia (http://www.fractovia.org/what/what_ing4.html) |
|
4C. More about some types of fractal.
|
4Ca. |
What are Julia sets? |
|
|
|
It has been previously said that when you iterate z(n+1)=z2(n)+c where z is the variable and c a constant, interesting fractal images can be obtained. The image will be drawn in the plane defined by the real and imaginary part of z. |
|
|||
|
|
Connected Julia set |
Disconnected Julia set |
||||
|
|
from http://fractals.iut.u-bordeaux1.fr Julia sets can be obtained with polynomials of any degree and any complexity (number of terms, coefficients of the terms, and so on). |
|||||
|
4Cb. |
What is the Mandelbrot set? |
|
|
|
The Mandelbrot set is clearly related to the Julia set z(n+1)=z2(n)+c but you must distinguish what is different. Now cis not a constant, but a variable, and the set is drawn in the plane defined by the real and imaginary values of c (the Mandelbrot set is drawn in the c plane when the Julia set is drawn in the zplane).
from Third Apex to Fractovia (http://www.fractovia.org/what/what_ing3.html) The Mandelbrot set was first studied by Benoît Mandelbrot (1980). He used the limited graphic capabilities of a computer of that “old” time to explore its characteristics. The name “Mandelbrot set” was given later by Douady and Hubbard (1982). |
|
|
4Cc. |
These images are curious but in no way spectacular. Why? |
|
|
|
These images represent only the points pertaining to the filled in Julia, or the Mandelbrot sets. But more information can be obtained from the iteration process. The most interesting concerns the points outside the set. Each of them has a distinct behavior and they can be colored according to the way they escape towards infinity. Much will be said later in part 5, but almost all the beautiful colored fractal images are obtained by exploring the properties (translated by varied colors) of points outside but near the boundary of the set. The points inside the set have also different behaviors and this can be used to color them, but these methods are less frequently used. |
|
|
4Cd. |
What is the connection between the Mandelbrot set and Julia sets? |
|
|
|
There is only one Mandelbrot set, but there are an infinity of Julia sets because c can be any complex number. Each point c in the Mandelbrot set specifies the geometric structure of the corresponding Julia set. If c is in the Mandelbrot set, the Julia set will be connected. If c is not in the Mandelbrot set, the Julia set will be a Cantor dust. In other words, the Mandelbrot set is the set of all the values of c for which the corresponding Julia set is connected. |
|
|
4Ce. |
How are the Julia and Mandelbrot sets computed? |
|
|
|
The process is rather similar. It has been explained previously that the Mandelbrot set iterates z2+c with z starting at 0 and varying c when the Julia set iterates z^2+c for fixed c and varying starting z values. The question is how to stop the iteration. |
|
|
4Cf. |
Where can I have more information about the Mandelbrot set? |
|
|
|
The Mandelbrot set has aroused a passionate interest. It has been said to be the most complex mathematical object known, a paradox if you remember that its formula is very simple. And yes, it is indeed a very complex object.
|
|
|
4Cg. |
Are Julia and Mandelbrot sets the only types of fractals using complex numbers? |
|
|
|
No. Don’t forget that by using polynomials of higher degree, with various number of terms and having coefficients of various values, you can have a great variety of Mandelbrot-like and Julia-like sets. |
|
|
4Ch. |
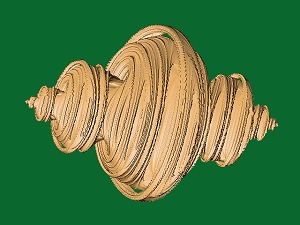
What are the images of quaternions? |
|
|
|
The first to calculate quaternionic fractals was Alan Norton (1982). Benoît Mandelbrot’s book “The fractal Geometry of Nature” shows two images of quaternionic fractals, and he mentions that the idea (and one of the two images) came from A. Norton.
Usually, the images of quaternionic fractals are images of the surface of a 3D Julia set seen from outside. To understand this, remember that the filled-in Julia set is the black area in the center of the left image on section 4Ca. If you imagine a generalized Julia set in the 3D space, the black zone is now a solid object. If you look at this object from outside you see something like the image below.
Note that it is possible to use hypercomplex numbers in the same way. An other family of totally unrelated objects, cubic complex polynomials, can also be represented in a 4D space in spite the fact that they only use complex numbers. The explanation of the cubic polynomial maths is perhaps too peculiar to be explained in this FAQ, but there is a good page by Ingvar Kullberg at For quaternions and hypernions:
|
|
|
4Ci. |
What is z-buffer? |
|
|
|
The principal problem of 3D objects is that they must be drawn on a 2D surface (that of the screen in computer art). The z-buffer is a part of the memory (usually an array) where the positions of each point in the depth dimension are stored. This information is then used to determine what parts of the object are visible and what parts are hidden by those in front of them. In ray-tracing programs, this information is also used to calculate the distance of each point to the light source and therefore its brightness. |
|
|
4Cj. |
What are the maths and the programming peculiarities of fractal music? |
|
|
|
The mathematics behind fractal music are somewhat the same as those behind fractal images. Some, but not all, iterate on formulae such as the Mandelbrot set. Even here, there is some divergence, as some calculate a note on each iteration while others calculate the note at “escape time”. Yet others use fractal methods that might be unsuitable for images, such as the Morse-Thue algorithm, Sierpinski Triangle, and Koch Snowflake. Other software uses iterated function systems to trace patterns over images and choose note parameters based upon the RGB value of the pixels traversed. Yet others use a “everything but the kitchen sink” approach by allowing the data to come from a variety of sources, then appropriate algorithms applied to the data. Most fractal music generators produce output in MIDI form. MIDI files are small, as they don't actually contain the sound, but instructions to your soundcard/sound module/other MIDI-enabled instrument on how to produce the sound. Much like the concept of vectored graphics such as Macromedia Flash. GM (General Midi) supports 128 instruments and 16 channels. GS MIDI supports these standards, but also hundreds of synth-bank variations on the basic 128 instruments, plus audio effects. Notable differences in the quality and sound of the MIDI file occur between the various types of soundcards/devices. Therefore any serious recording of fractal music necessitates recording the MIDI file to a common audio format for public consumption. Writing MIDI files can be a daunting task. One helpful midi source for freeware programmers is Piet van Oostrum’s text-to-midi converter (t2mf.) With those routines, and the docs included, a programmer can convert fractal data to text, then convert the text to a midi file. What data is used to create the midi text can vary from the potential of z at an escape point, any data from rendering, or a point’s color index. Since midi involves many variables, length of note, pitch, spacing between notes, etc. different rendering data can be used to control all these simultaneously. This typically requires storing the data in buffers as a fractal is drawn, then converting/scaling it before writing the text file.
For reading and writing Standard MIDI Files, you should make use of the freely available C source code that has been floating around the net since the standard was first created. A copy may be found at:
A nice collection of links to MIDI programming resources is here: Also, a great collection of MIDI utilities is Gunter Nagler’s Midi Utilities site. It’s one of the best sites for Midi applications: Some programs convert images into music while others generate music by applying various algorithmic and recursive procedures directly, or apply the principle that man-composed music has a spectral density not far from 1/f, as found by Richard F. Voss and John Clarke. For more theoretical information on these topics, read:
|
|